Programming
Writing clean, maintainable code for data, backend, and web.
Building intelligent systems, turning data into real-world impact.
Computer Science student at MSA University with a strong focus on Machine Learning, Data Science, Data Analysis, and AI applications.
I enjoy taking ideas from raw data all the way to usable products — from EDA and feature engineering, through modeling and evaluation, to interactive dashboards and web apps that non-technical stakeholders can actually use.
I work primarily with Python, TensorFlow, Keras, Scikit-learn, and Streamlit, and I am comfortable collaborating across technical and business teams to design solutions that are both accurate and practical in real-world environments.
I am currently looking for internships, part-time roles, full-time roles, and freelance projects where I can contribute to data-driven products, ML systems, and analytics platforms.
Technologies and techniques I use to deliver data-driven solutions.
Writing clean, maintainable code for data, backend, and web.
Designing, training, and optimizing ML/DL models.
From exploration and visualization to production-ready analytics.
Designing and querying structured and unstructured data stores.
Core data science and ML techniques I apply across projects.
Selected work highlighting end-to-end machine learning, data science, and deployment experience.
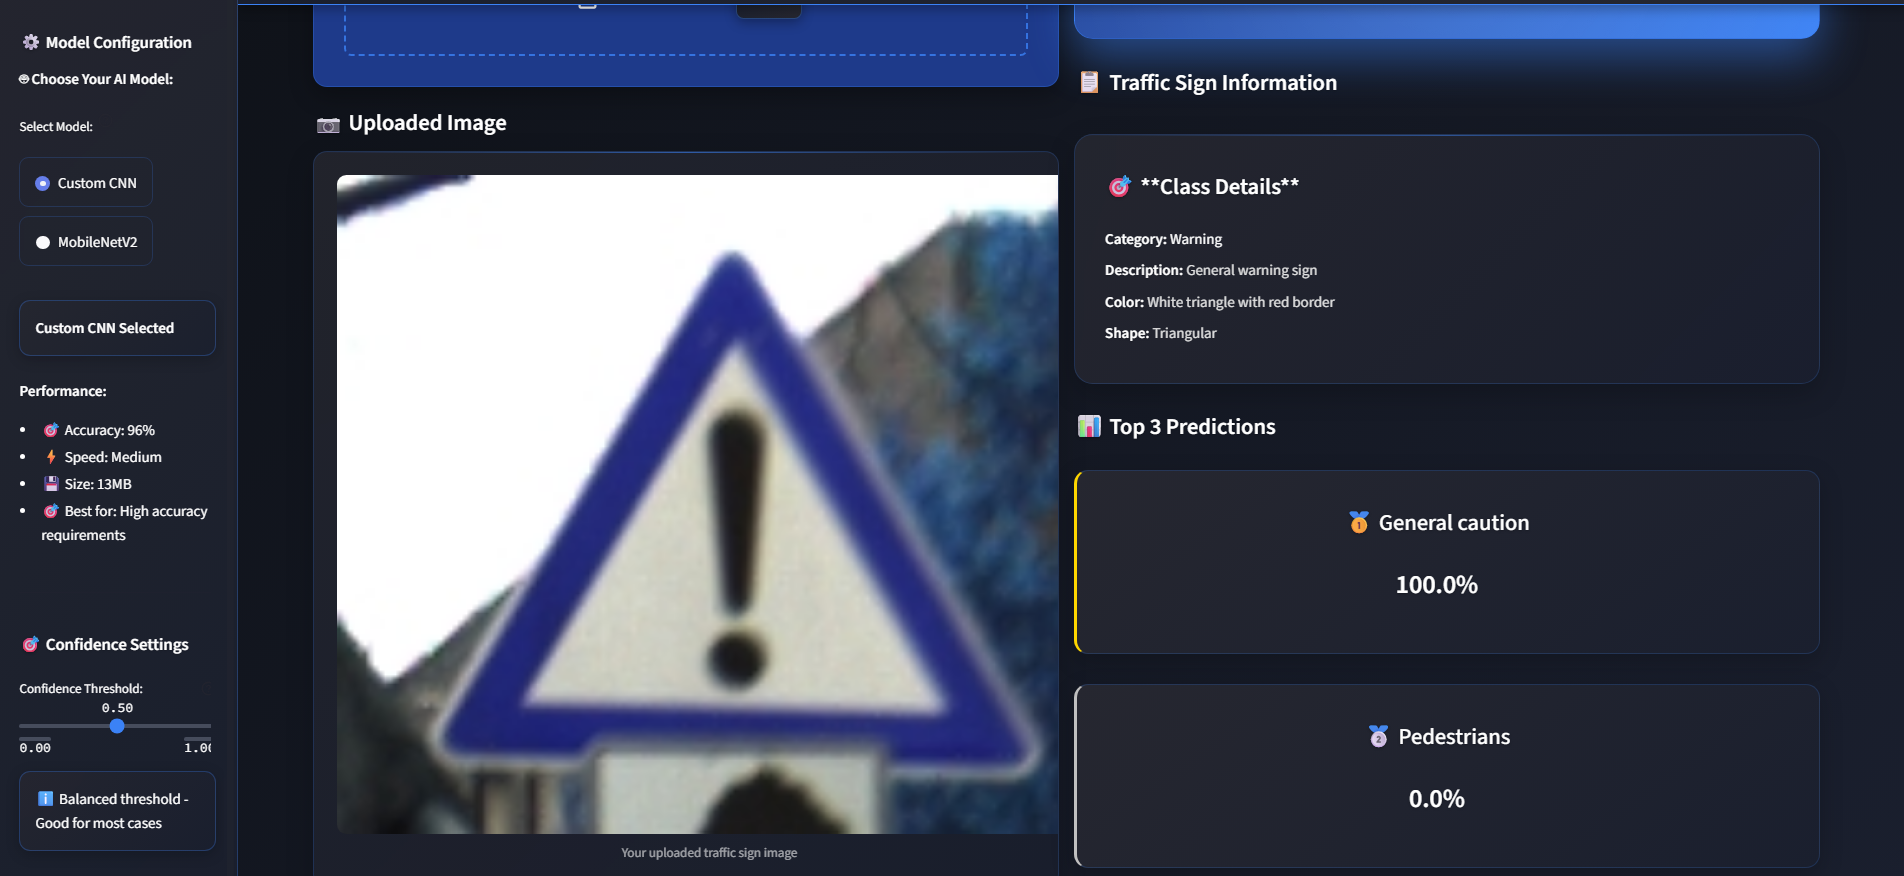
Deep learning system that classifies 43 traffic sign categories using a CNN and transfer learning, deployed via a Streamlit web app for real-time image uploads.
Impact: 43-class real-time traffic sign classification workflow.
Tech: TensorFlow, Keras, CNN, MobileNetV2, Pandas, Matplotlib, Streamlit
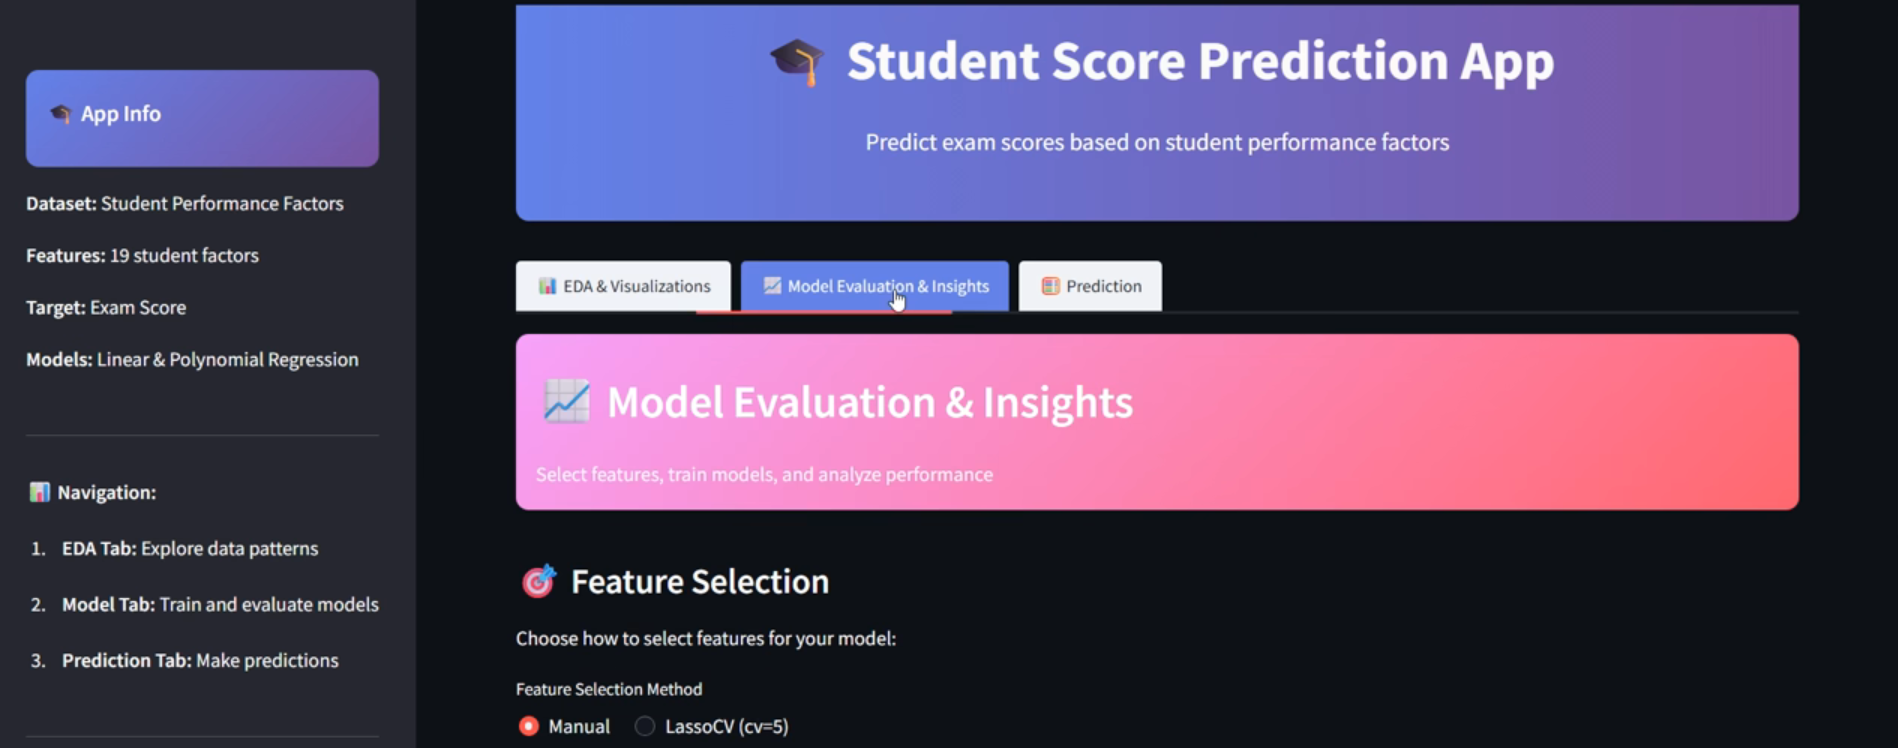
Predictive web app that estimates student exam scores using regression models, feature selection, and interactive visualizations for residuals and performance metrics.
Impact: Fast score prediction interface for student performance insights.
Tech: Python, Pandas, Scikit-learn, LassoCV, Regression, Streamlit
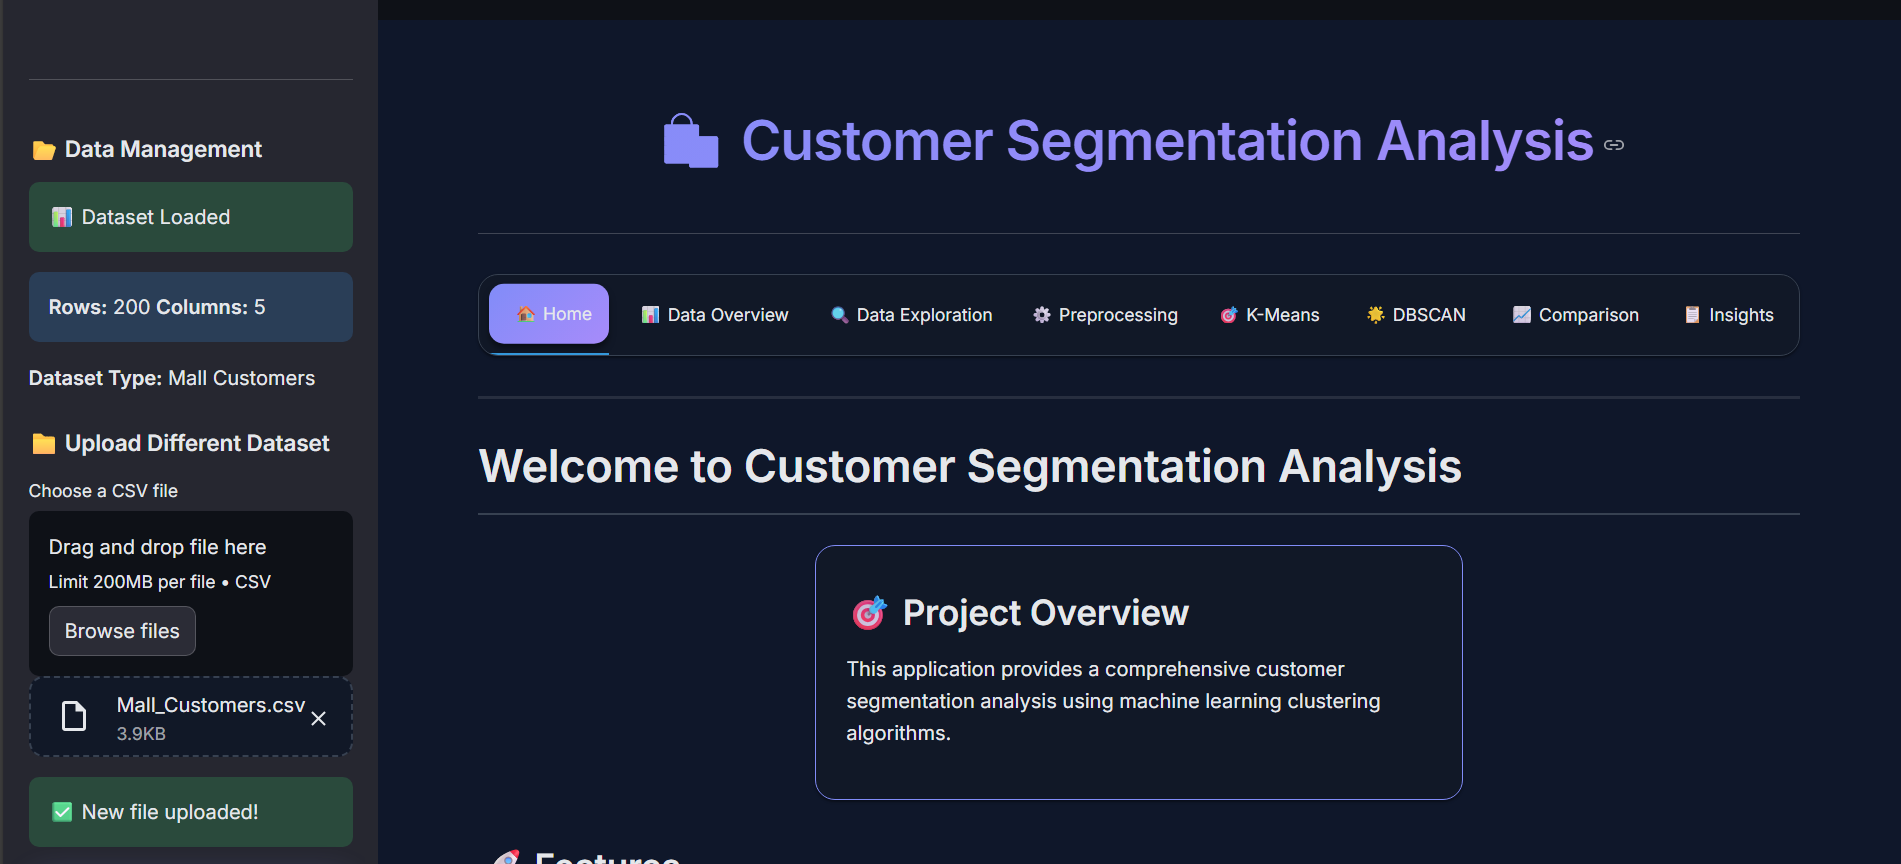
Unsupervised learning project segmenting customers based on purchasing behavior to support targeted marketing and loyalty strategies, with interactive dashboards.
Impact: Actionable customer segments for targeted retention campaigns.
Tech: K-Means, DBSCAN, Pandas, Scikit-learn, Matplotlib, Seaborn, Streamlit
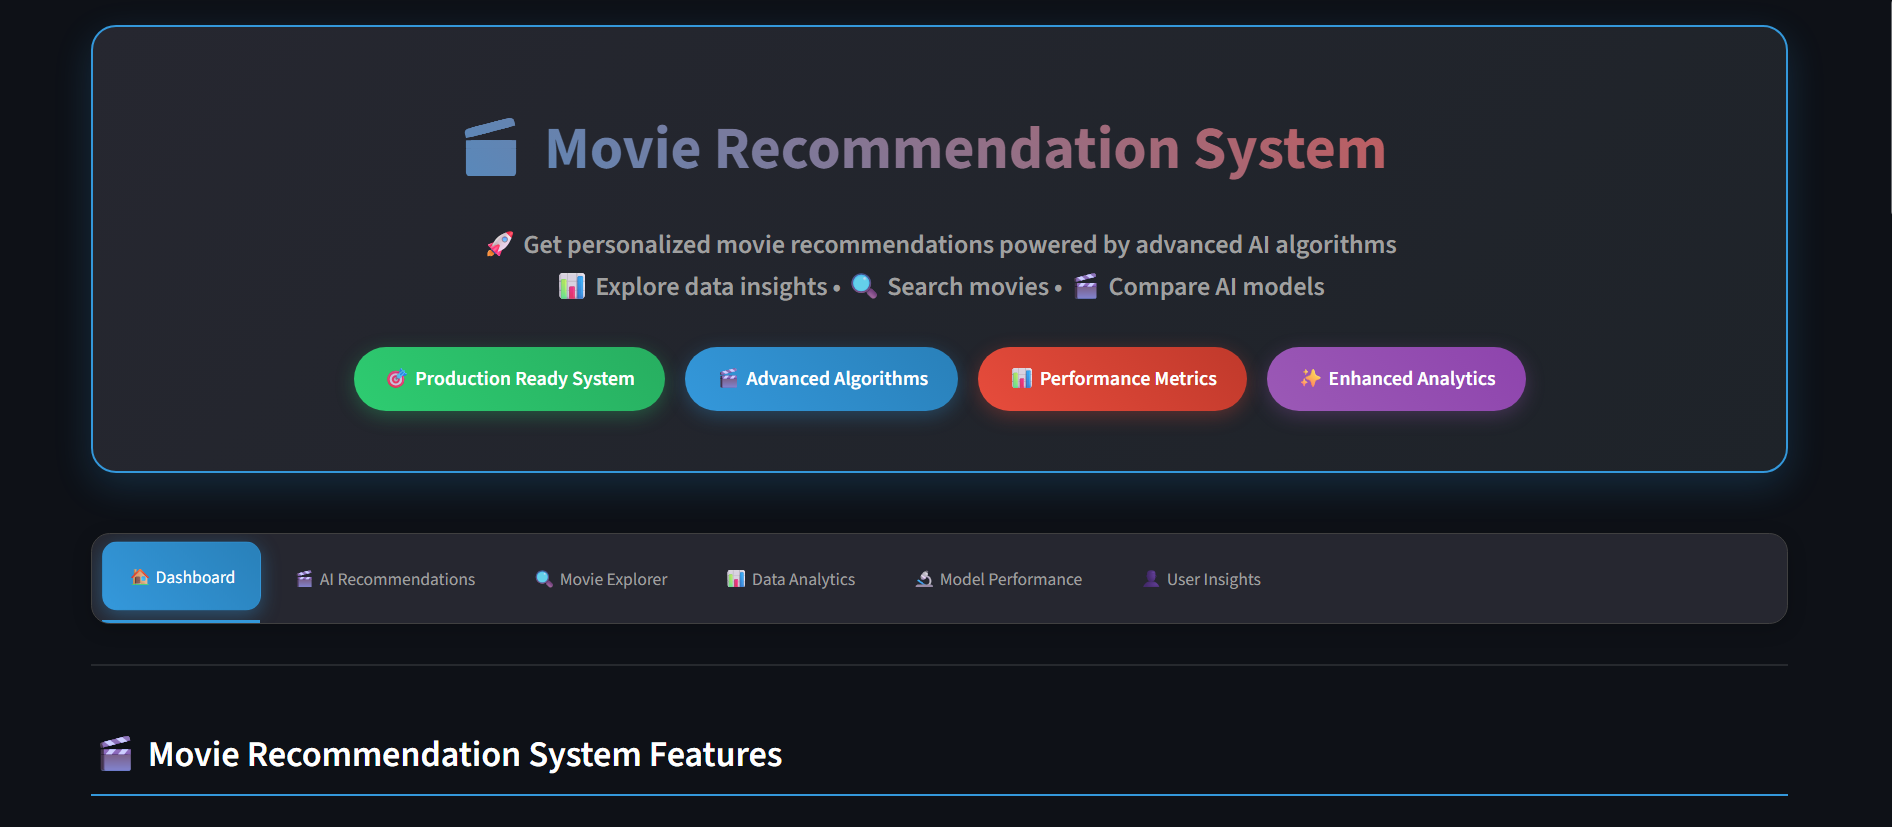
Recommendation engine combining content-based and collaborative filtering to suggest relevant movies based on user preferences and viewing history.
Impact: Personalized movie suggestions using hybrid recommendation logic.
Tech: Python, Pandas, Scikit-learn, TF-IDF, Cosine Similarity, Recommendation Systems
Power BI reporting projects grouped by dataset and business context.
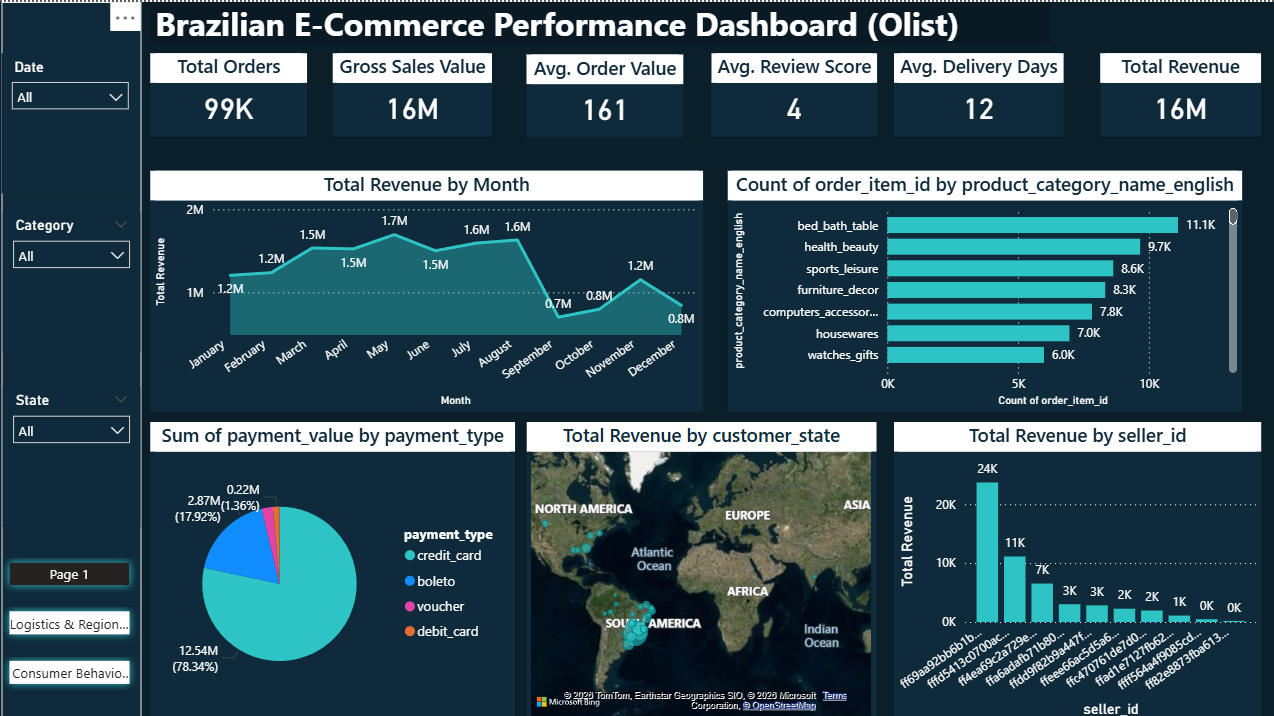
Multi-page Power BI dashboard built on Olist data to track order volume, revenue, delivery performance, customer behavior, and category trends for business decision-making.
Impact: 99K orders and 16M revenue performance tracking.
Tech: Power BI, DAX, Data Modeling, Power Query, KPI Design
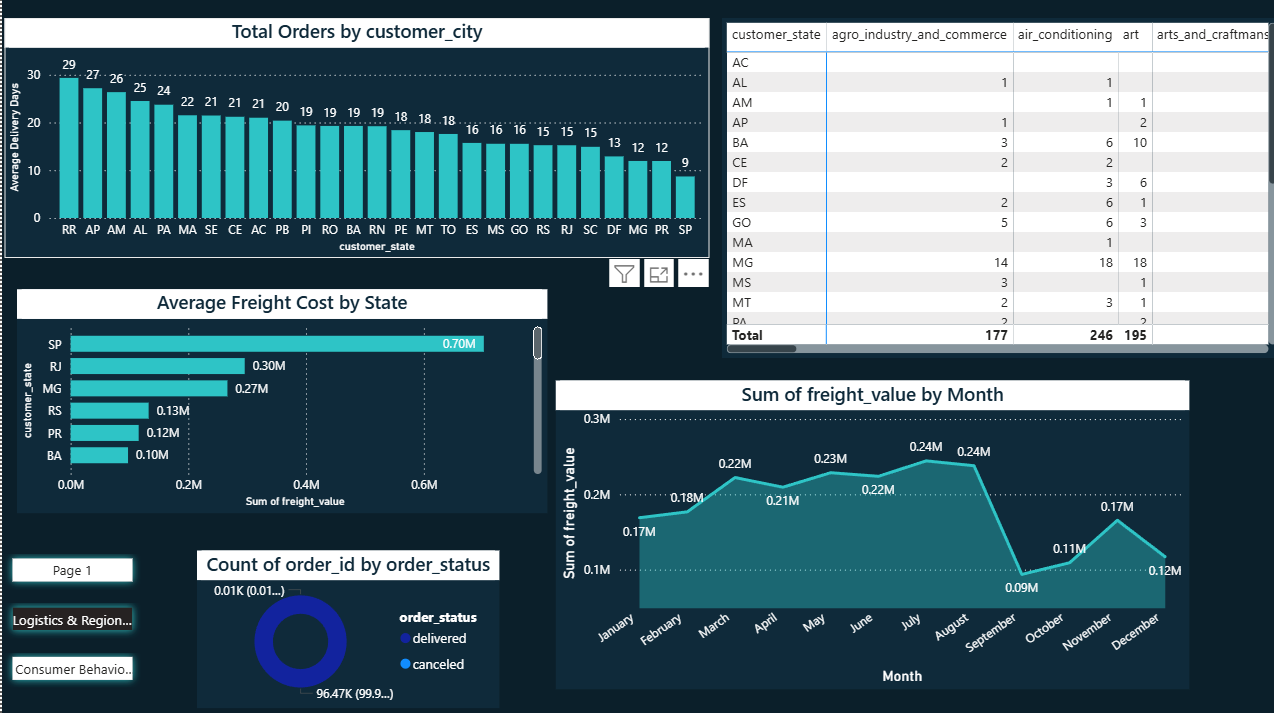
Focused logistics analysis page showing freight trends by month, delivery time by state, shipping cost comparison, and order-status distribution to highlight operational bottlenecks.
Impact: Logistics bottlenecks identified across delivery and freight KPIs.
Tech: Power BI, DAX, Logistics Analytics, Time-Series KPI
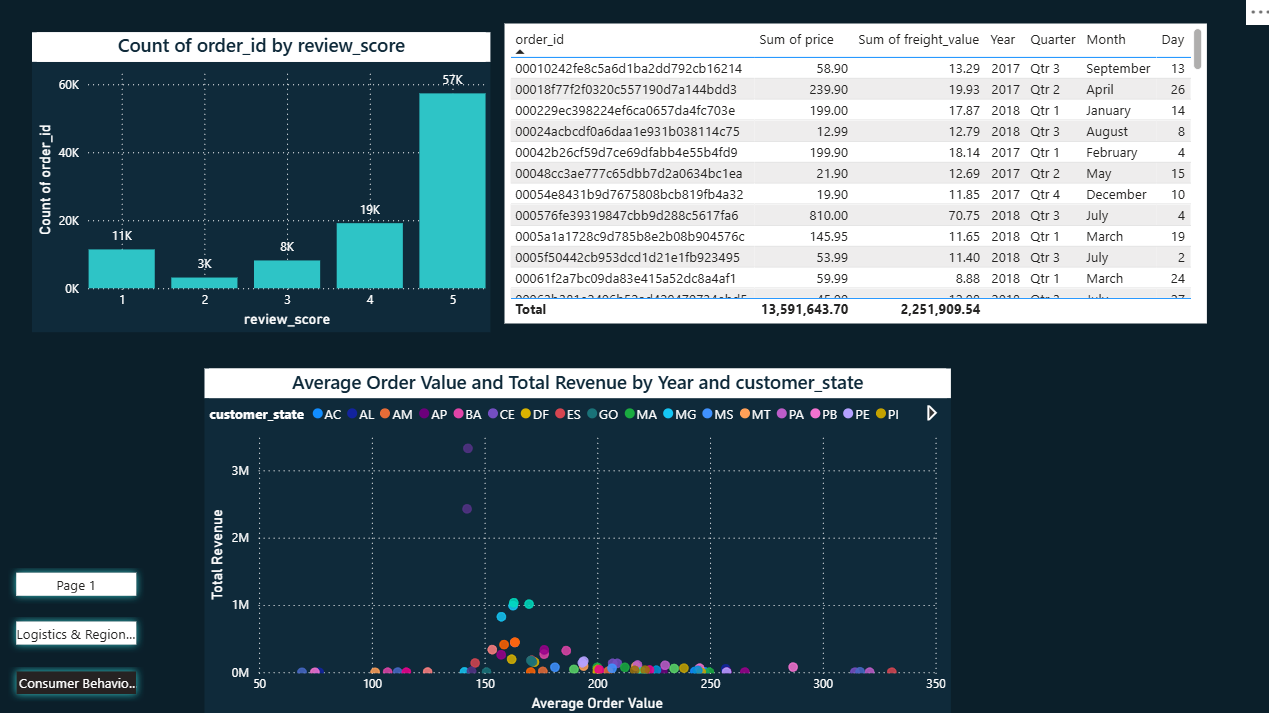
Customer behavior analysis page combining review scores, order-value patterns, and regional customer metrics to support retention and customer experience improvements.
Impact: Improved customer-experience visibility via review and value analysis.
Tech: Power BI, DAX, Customer Analytics, Scatter and KPI Visuals
/Screenshot 2025-07-13 211604.png)
Interactive HR analytics dashboard covering salaries, hiring trends, department distribution, gender analysis, and drillthrough insights to support workforce planning and performance reviews.
Impact: Workforce planning view across hiring, salary, and gender metrics.
Tech: Power BI, DAX, HR Analytics, Data Modeling, Drillthrough
/Screenshot 2025-07-15 003133.png)
Interactive sales dashboard tracking sales trend over time, city-level sales distribution, product contribution, and date-based slicers for quick performance reviews.
Impact: Clear time-based city sales trends for business follow-up.
Tech: Power BI, DAX, Sales Analytics, Slicers, Interactive Charts
/Screenshot 2025-07-17 030707.png)
Workforce analysis page showing employee distribution by department, gender ratio, annual hiring trend, and key HR KPIs for management reporting and headcount planning.
Impact: Department-level headcount and gender distribution benchmarking.
Tech: Power BI, DAX, HR KPIs, Department Analytics
/Screenshot 2025-07-17 030716.png)
Salary analytics page comparing departments by total salary, experience-level mix, and gender-based salary evolution to support compensation and organizational decisions.
Impact: Salary-equity visibility by department and experience groups.
Tech: Power BI, DAX, Salary Analytics, Department Benchmarking
/Screenshot 2025-07-17 030722.png)
Dedicated drillthrough page for selected employee details, comparing individual salary against department averages and showing focused contextual metrics for deeper HR analysis.
Impact: Drillthrough details for rapid employee-level investigations.
Tech: Power BI, Drillthrough, DAX Measures, Employee Analytics
Hands-on internships and training programs across AI, data science, and IT.
Developed and deployed multiple end-to-end ML projects, including Traffic Sign Recognition, Student Score Prediction, and Customer Segmentation, achieving high accuracy and real-world usability.
Completed intensive training covering data science fundamentals, business process analysis, and full-stack web development with a focus on deploying functional data-driven applications.
Built strong foundations in AI and deep learning, including neural networks, probability & statistics, linear algebra, and optimization, applied in a hands-on AI project.
Gained practical exposure to enterprise IT operations in the oil and gas sector, supporting infrastructure, networks, and data-driven workflows.
Participated in virtual training programs and HR development initiatives, gaining insights into how large organizations build and upskill teams.
Formal training that complements my project and internship experience.
30 hours of training covering the full data lifecycle: cleaning, EDA, AI-driven prediction, and dashboard automation. Final grade: 80%.
Core concepts of data science, data analysis, and data-driven decision making.
Practical experience working with Linux systems and command-line tools.
Multiple intensive programs in AI, machine learning, and data science through ITI, MCIT, and other initiatives.
Open to internships, part-time roles, full-time roles, and freelance data projects.